
On the “Useful Map for Foreign Residents” that I run as NIC Co., Ltd., you can search for trends in the number of foreign residents in all local governments. It is known that the number of foreign residents is on the rise, but you can realize that the speed of increase and the distribution by nationality and status of residence vary greatly depending on the local government on the website.
Steps to the foreign resident statistics screen
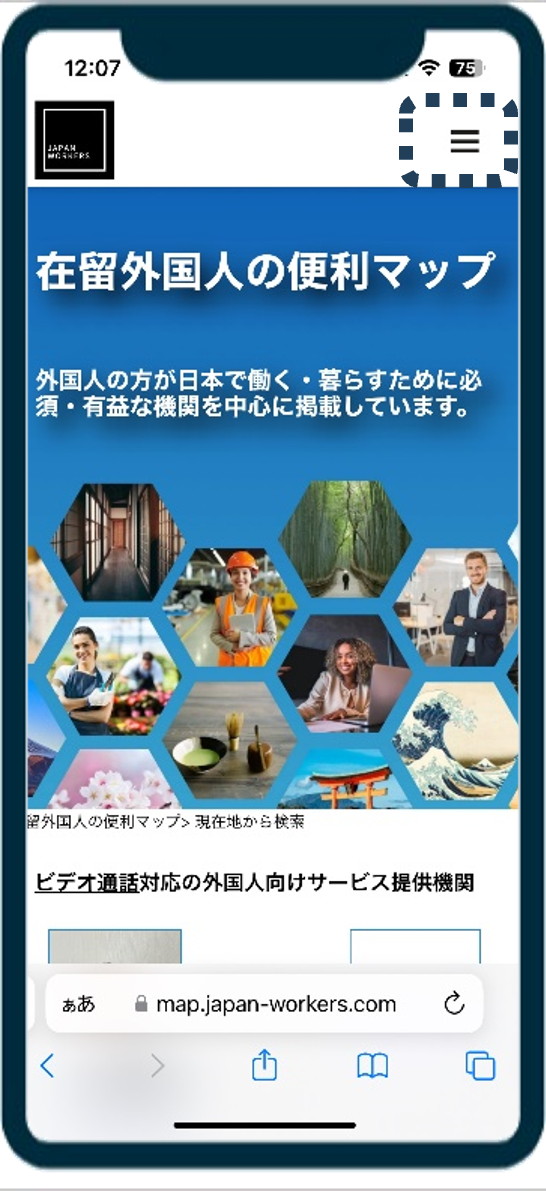 | Tap the menu icon at the top right of the screen. |
 | Tap Foreign Resident Statistics. |
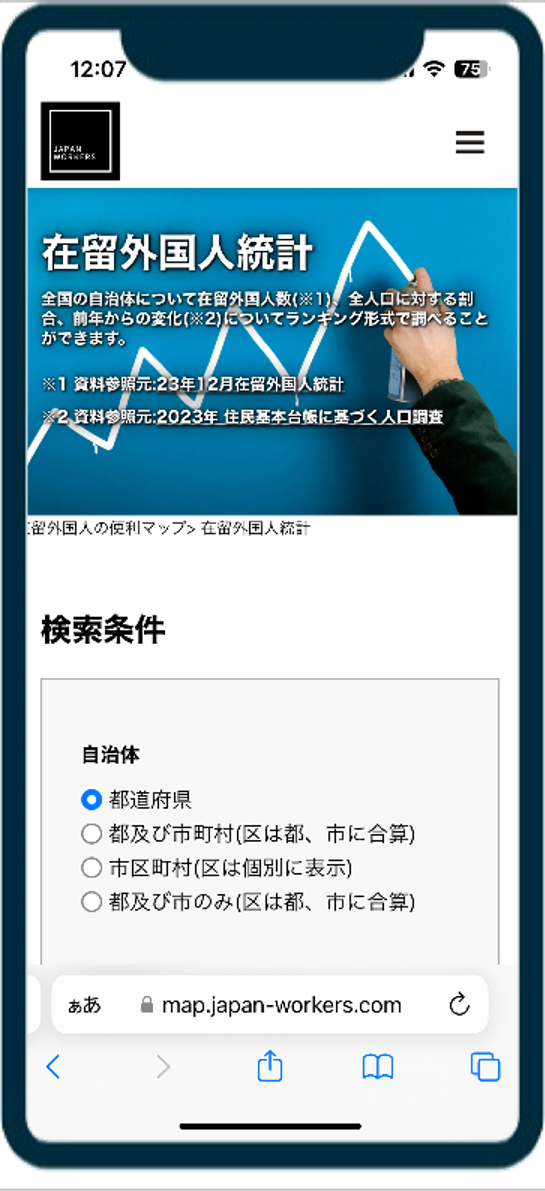 | The foreign resident statistics screen has been displayed. |
Search at prefecture (special ward) level
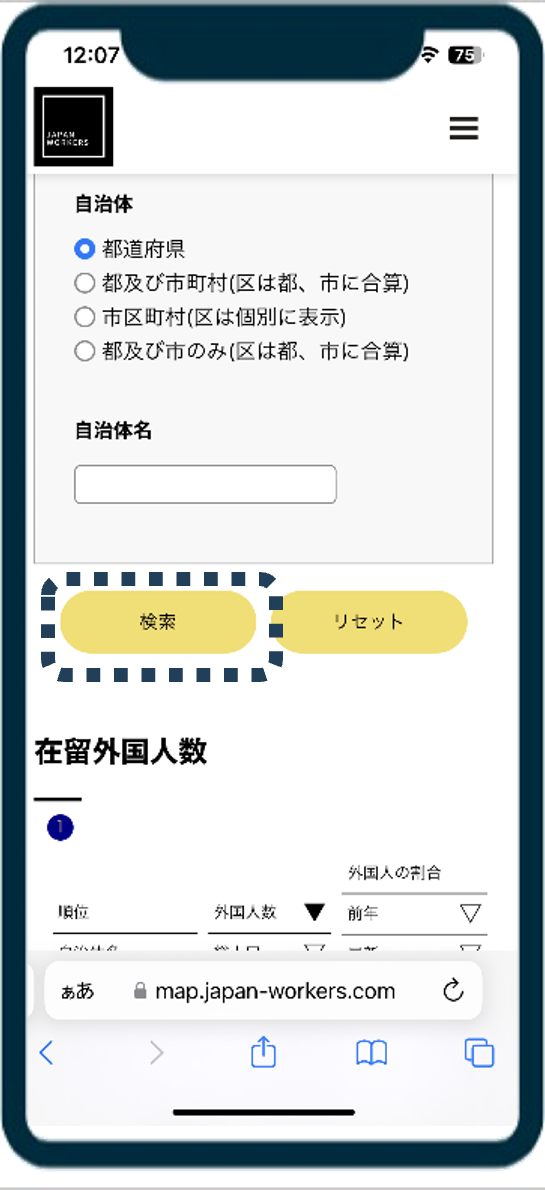 | The default search option is by prefecture. Just tap the search button. |
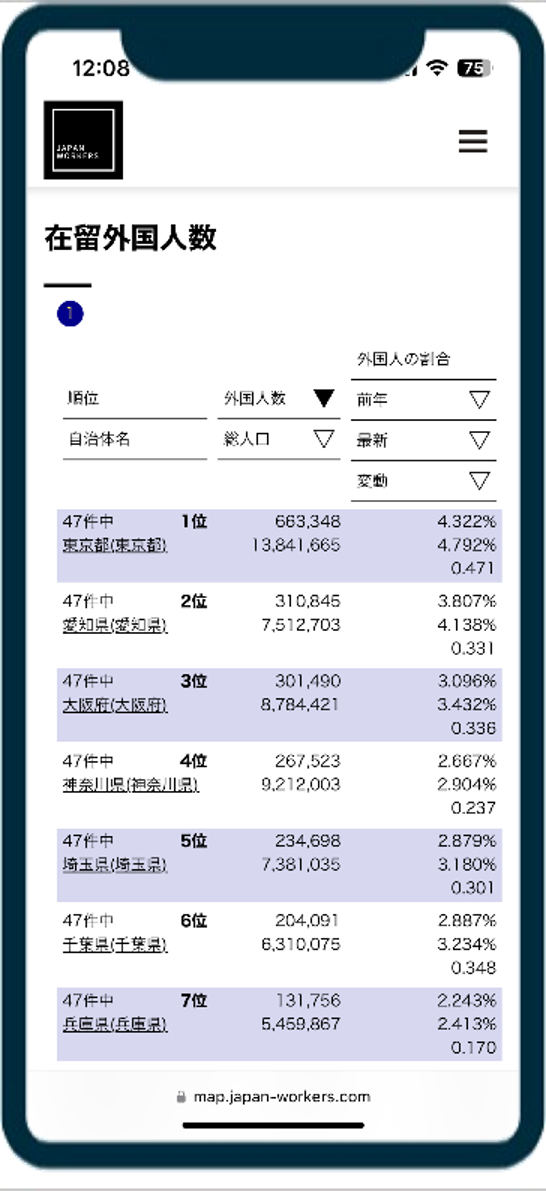 | Displayed in descending order of number of foreign residents. Of course, Tokyo is at the top. |
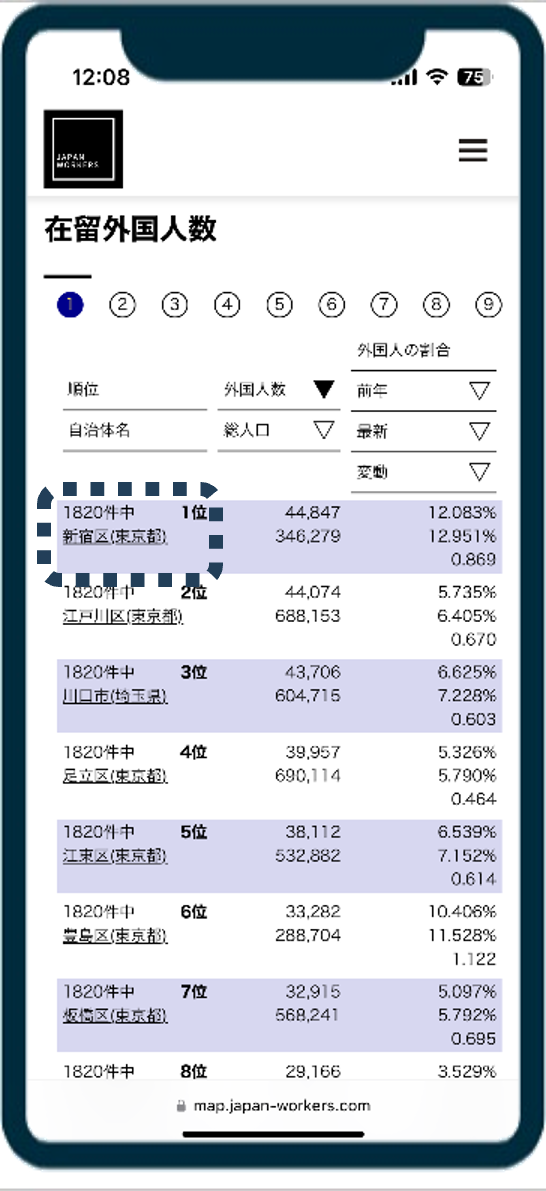 | Tap the underlined part of the municipality name. |
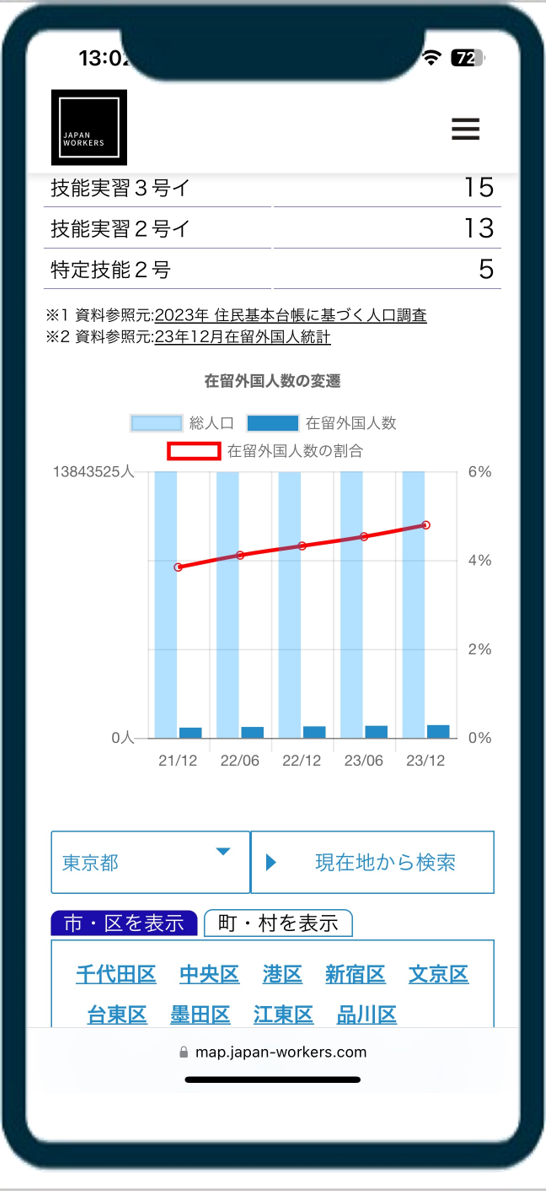 | You will be redirected to the top screen with the target municipality selected. You can see an increase in the number and proportion of foreign residents over the past five semi-annual periods. The number of foreign residents in Tokyo is 663,000, and the percentage is 4.792%, so out of about 100 people, 5 are foreigners. The rate of increase in Tokyo as a whole is slow, but shocking data is yet to come. |
City/Village level search (“percentage” of foreign residents)
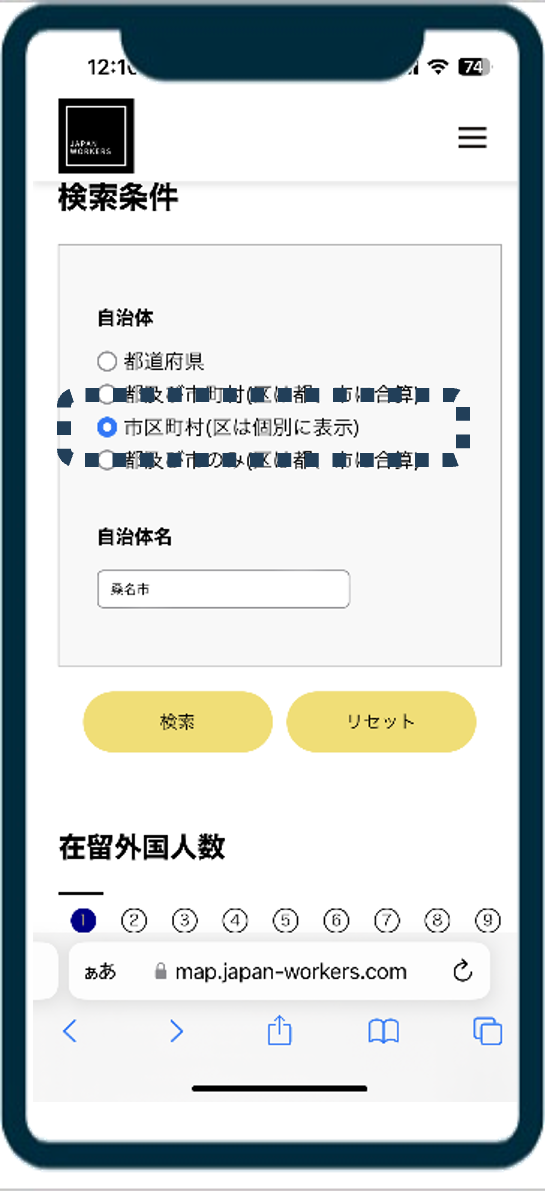 | Next, tap the Search button with the search option as city/village. |
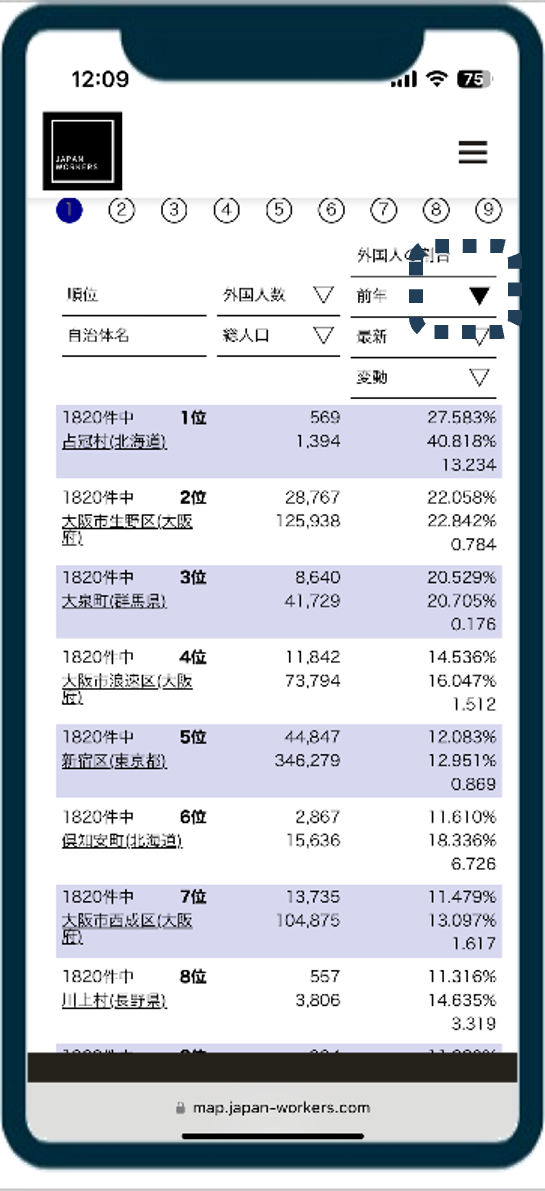 | Tap the ▽ button to the right of the “Ratio of foreign residents: latest” in the heading row to display the ratio of foreign residents to residents in descending order. (▽ becomes ▼.) At the top of the ranking is Shimukappu Village in Hokkaido. The latest figure is over 40%, with 4 out of 10 being foreigners. Tomamu Resort is located in Shimukappu Village, and many foreigners work there. Tap the area that says Shimukappu Village. |
 | The results are surprising not only in the percentage of foreign residents but also in the rate of increase. I am a little concerned about whether local governments can withstand this rapid change. |
City/Village level search (“increase rate” of foreign residents)
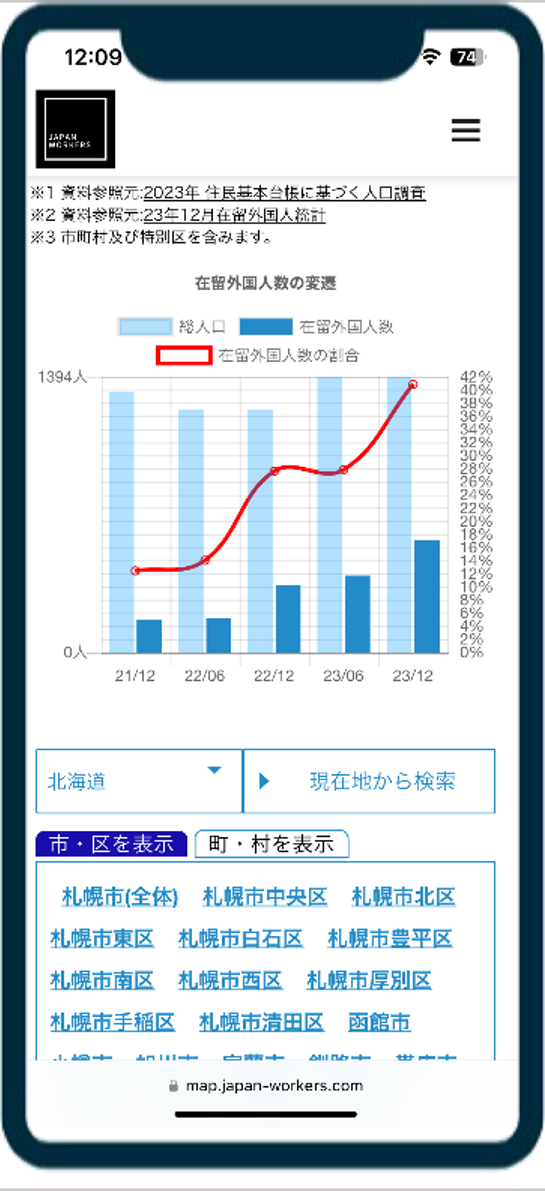
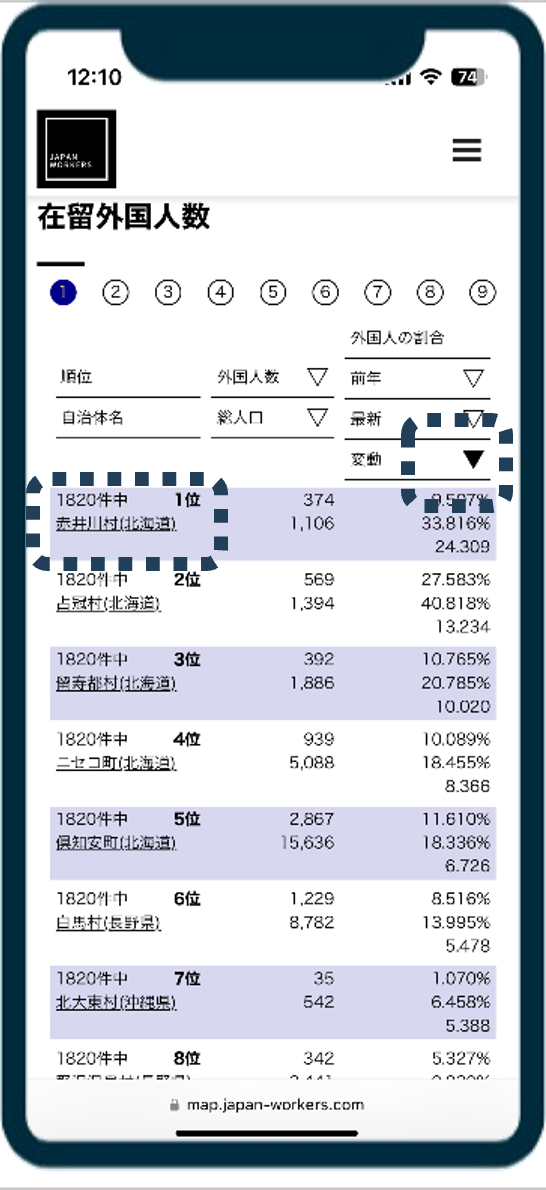 | Next, tap the ▽ button to the right of the “Ratio of foreign residents: change” in the heading row to display the change of ratio of foreign residents to residents in descending order. (▽ becomes ▼.) Top of the ranking is Akaigawa Village in Hokkaido. This is a dramatic increase from 9.5% to 33.8% in one year. This means that the number of foreigners has increased from one out of ten to three in just one year. Like Shimukappu Village, the rapid increase in Akaigawa Village is due to the employment of foreigners in the resort industry (Niseko area, Kiroro Resort). Tap the area that says Akaigawa Village. |
 | Although the number of foreigners is smaller than that of Shimukappu Village, the rapid rise in the line graph showing the rate of increase is surprising. |
Search by local government name
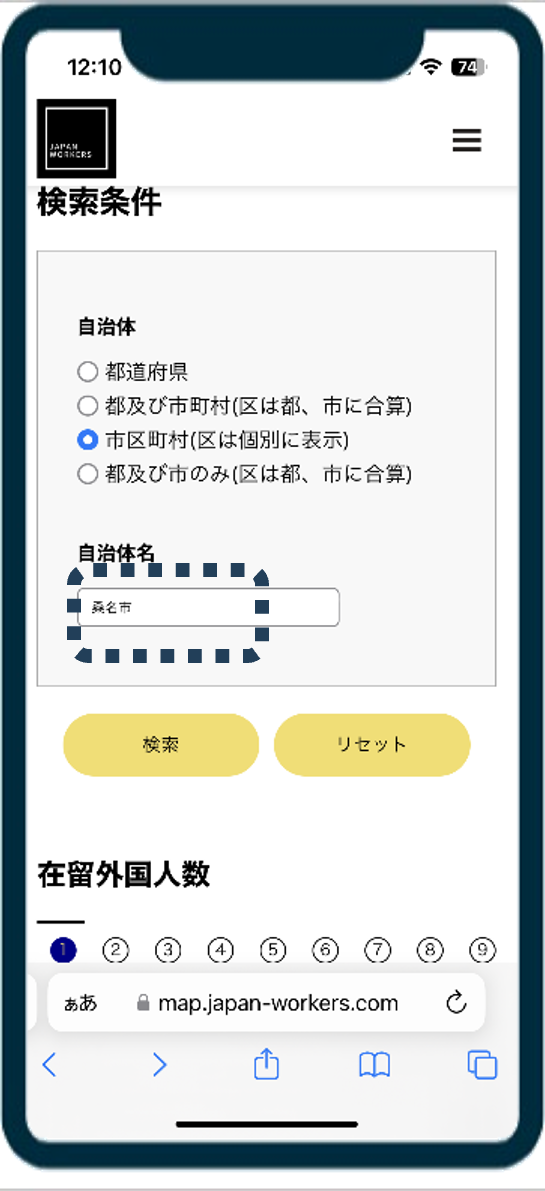 | You can check the ranking by specifying the name of the municipality. My parents’ home is Kuwana City, Mie Prefecture, so enter Kuwana City and tap the search button. |
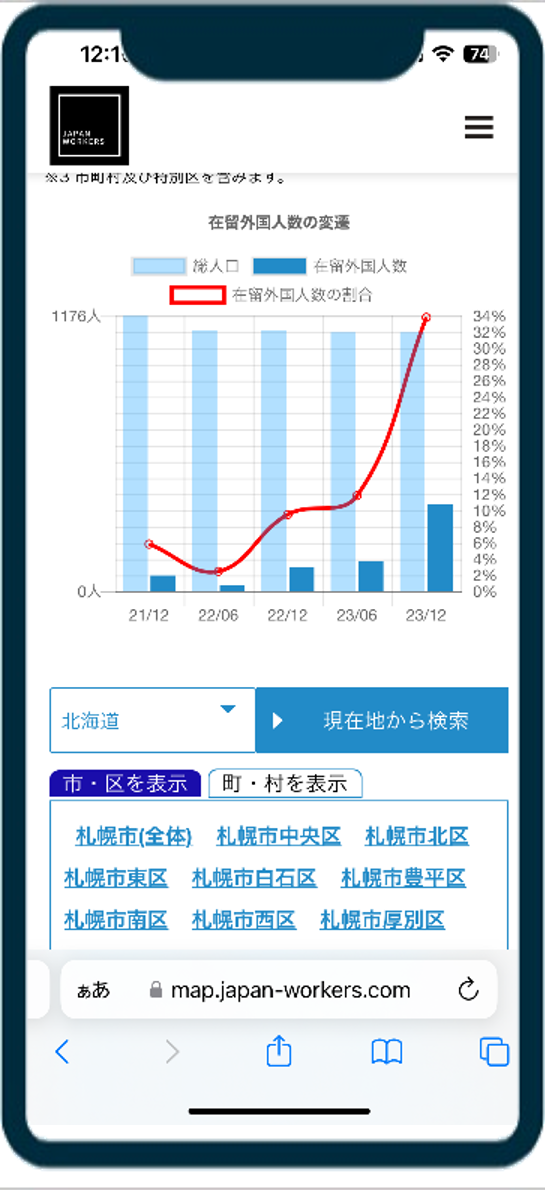
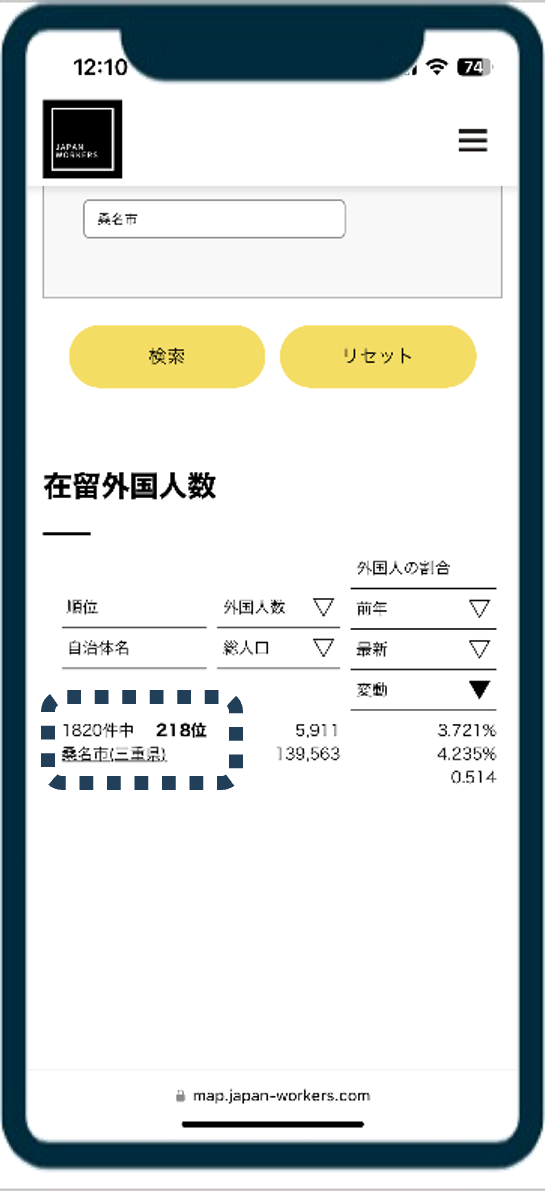 | You can see that it ranks 218th out of all local governments. Tap the municipality name. |
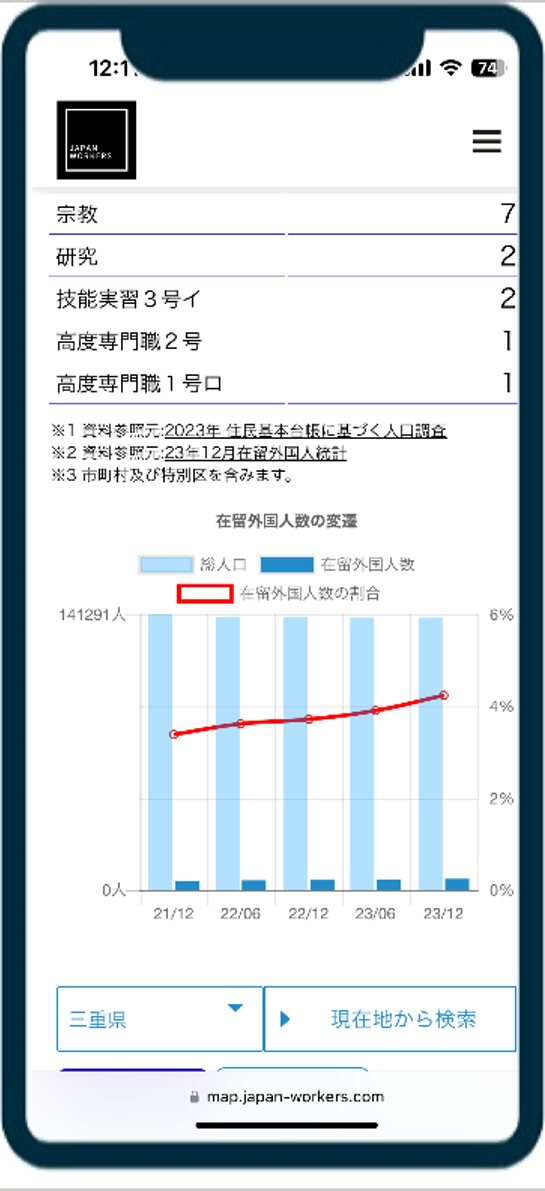 | The rate of increase was modest. |
Summary
The number of foreigners in your own town may be increasing more rapidly than you expected, and the actions to prepare for co-existence with foreign residents may need to be taken much earlier than expected.
Japan Immigration News